As industries and businesses continue to expand, the demand for efficient and reliable logistics, transport, and shipping services has never been higher. One tool that has gained prominence in this fast-paced and complex environment is the Sawtooth Diagram. This innovative concept has revolutionized the way companies plan and optimize their supply chain operations. Join us as we delve into the intricacies of the Sawtooth Diagram and explore how it is reshaping the future of logistics, transport, and shipping.
Introduction: Understanding Sawtooth Diagrams in Logistics
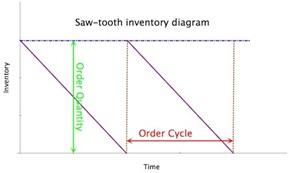
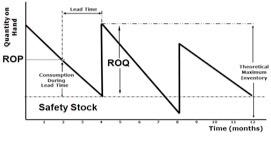
Sawtooth diagrams are a vital tool in the world of logistics, providing a visual representation of inventory levels over time. Understanding these diagrams can help businesses optimize their transportation and shipping processes, leading to improved efficiency and cost savings.
One key feature of sawtooth diagrams is the alternating pattern of peaks and valleys, which correspond to periods of stock replenishment and depletion. By analyzing these patterns, logistics professionals can identify trends, forecast future inventory needs, and make informed decisions about inventory management strategies.

Benefits of Implementing Sawtooth Diagrams in Transport Management
Sawtooth diagrams are a valuable tool in transport management for visualizing and analyzing complex logistics data. By presenting data in a clear and structured way, sawtooth diagrams help transport managers make more informed decisions and optimize transportation routes. This can lead to cost savings, improved efficiency, and better customer satisfaction.
One of the key is their ability to highlight patterns and trends in data. This can help transport managers identify areas for improvement, such as reducing idle times, optimizing delivery schedules, and minimizing transportation costs. With sawtooth diagrams, transport managers can track the performance of their transportation operations and make data-driven decisions to enhance overall efficiency and effectiveness.

Improving Efficiency in Shipping Operations with Sawtooth Diagrams
When it comes to improving efficiency in shipping operations, Sawtooth Diagrams can be a game-changer. These visual tools provide a clear and concise way to analyze and optimize the flow of goods from production to delivery. By using Sawtooth Diagrams, logistics companies can identify bottlenecks, streamline processes, and ultimately save time and money.
One of the key benefits of Sawtooth Diagrams is their ability to show the progression of shipments through various stages of the shipping process. This allows for easy identification of areas where there may be delays or inefficiencies. By addressing these issues, companies can improve overall operational efficiency and customer satisfaction. In addition, Sawtooth Diagrams can help with capacity planning, resource allocation, and route optimization, leading to a more streamlined and cost-effective shipping operation.

Best Practices for Utilizing Sawtooth Diagrams in Logistics Strategy
When it comes to utilizing sawtooth diagrams in logistics strategy, there are a few best practices to keep in mind. Firstly, it’s important to clearly define the key performance indicators (KPIs) that you want to track using the sawtooth diagram. This could include metrics such as on-time delivery rates, inventory turnover, or transportation costs.
Another important practice is to regularly update and analyze your sawtooth diagrams to identify trends and areas for improvement. By tracking KPIs over time, you can gain valuable insights into your logistics operations and make data-driven decisions to optimize your supply chain. Additionally, don’t forget to communicate findings and action plans to relevant stakeholders to ensure alignment and buy-in for strategic changes.
Closing Remarks
In conclusion, the sawtooth diagram is a valuable tool in visualizing and optimizing logistics, transport, and shipping processes. By understanding the flow of goods through various stages and identifying potential bottlenecks, businesses can improve efficiency, reduce costs, and ultimately enhance customer satisfaction. Whether you are a small local retailer or a global corporation, incorporating the sawtooth diagram into your supply chain management strategy can help you stay ahead of the competition in today’s rapidly evolving marketplace. So why wait? Start sawing through your logistics challenges today and unlock the potential for growth and success in your business.
